Data · Wait Times
Average TSA wait times at U.S. airports: the data
By the TSA Wait Times team · Updated · Published July 2026
The average TSA wait in a standard security lane at a large U.S. airport is about 19 minutes on a typical day, per the tsawaittimes.app forecasting model's 2026 snapshot of 32 major airports. That single number hides the real story: the same national curve dips to about 10 minutes at 5 AM and climbs to 30 minutes at the 6 PM peak, and the modeled airport averages span 14 to 25 minutes. Every figure below is a modeled estimate from our own model — the full table, hour curve, and methodology are on this page.
The national average: 19 minutes
Averaging the modeled typical-day wait across all 32 airports in this study gives 19 minutes in a standard lane. Two things to hold next to that number. First, it is a first-party modeled estimate — TSA publishes no official average wait, only a service standard of under 30 minutes in standard lanes and under 10 minutes in PreCheck lanes. Second, averages flatten the peaks: the modeled peak-hour wait at the busiest airports in this table reaches 40 minutes, roughly double the national average. For what a wait means for your departure time, see how early to arrive at the airport.
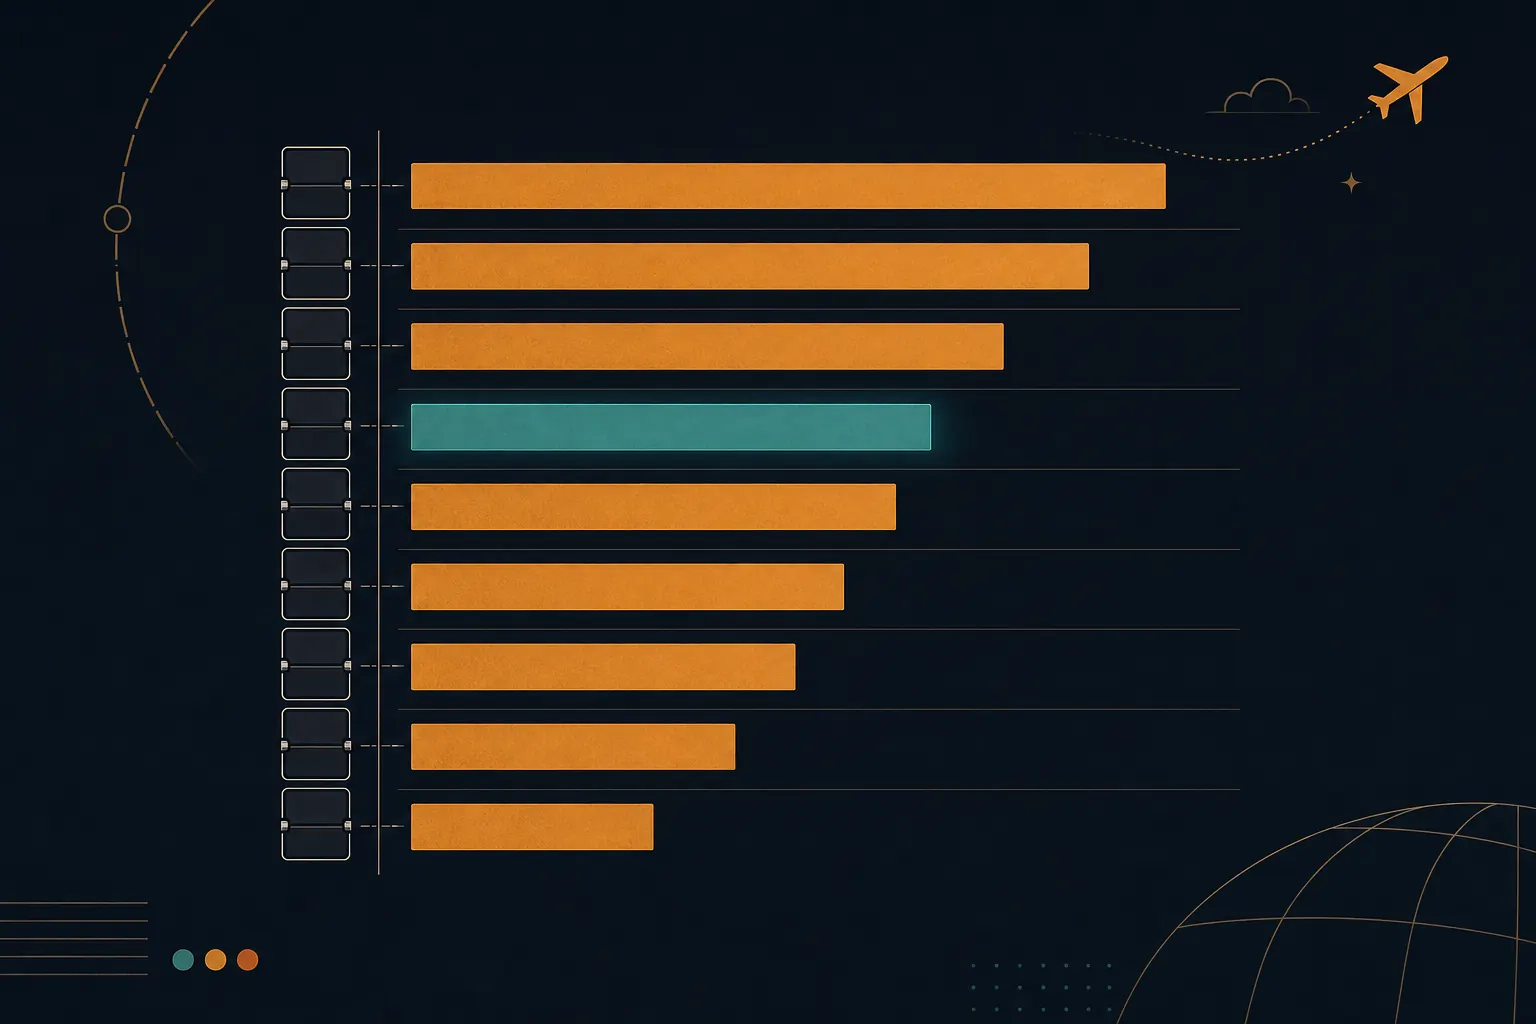
The 10 longest-wait airports
Ranked by modeled average standard-lane wait across a typical day. These are our model's typical-day estimates, not a measured ranking — treat small gaps between airports as noise.
| Airport | Avg wait | Peak |
|---|---|---|
| HNL Honolulu | 25 min | 40 min at 6 PM |
| BWI Baltimore | 24 min | 38 min at 6 PM |
| PHX Phoenix | 24 min | 38 min at 6 PM |
| AUS Austin | 23 min | 36 min at 6 PM |
| LAX Los Angeles Int'l | 23 min | 36 min at 8 AM |
| SFO San Francisco | 23 min | 35 min at 8 AM |
| TPA Tampa | 23 min | 35 min at 6 PM |
| DCA Washington · Reagan | 22 min | 35 min at 8 AM |
| MDW Chicago · Midway | 22 min | 34 min at 8 AM |
| BOS Boston | 21 min | 34 min at 6 PM |
The 10 shortest-wait airports
The other end of the same table — large airports whose modeled typical-day average stays in the mid-teens.
| Airport | Avg wait | Peak |
|---|---|---|
| SEA Seattle–Tacoma | 14 min | 21 min at 8 AM |
| SAN San Diego | 15 min | 24 min at 6 PM |
| JFK New York · JFK | 15 min | 24 min at 8 AM |
| CLT Charlotte | 15 min | 25 min at 6 PM |
| BNA Nashville | 16 min | 25 min at 8 AM |
| SLC Salt Lake City | 16 min | 26 min at 7 PM |
| MCO Orlando | 16 min | 26 min at 6 PM |
| EWR Newark | 16 min | 26 min at 8 AM |
| DFW Dallas/Fort Worth | 16 min | 26 min at 6 PM |
| MSP Minneapolis–St. Paul | 17 min | 27 min at 6 PM |
When waits peak: the national hour-by-hour curve
The modeled national curve (the mean of the 32 airports' typical-day curves) has two humps: a morning peak of 29 minutes at 8 AM and the day's highest point, 30 minutes at 6 PM. The quietest reasonable arrival hour is 5 AM, at about 10 minutes.
| Hour (local) | Modeled avg wait |
|---|---|
| 4 AM | 6 min |
| 5 AM | 10 min |
| 6 AM | 17 min |
| 7 AM | 26 min |
| 8 AM | 29 min |
| 9 AM | 25 min |
| 10 AM | 19 min |
| 11 AM | 17 min |
| 12 PM | 19 min |
| 1 PM | 20 min |
| 2 PM | 19 min |
| 3 PM | 17 min |
| 4 PM | 19 min |
| 5 PM | 25 min |
| 6 PM | 30 min |
| 7 PM | 28 min |
| 8 PM | 22 min |
| 9 PM | 16 min |
| 10 PM | 11 min |
Operating hours (4 AM–10 PM) shown; overnight modeled waits run 5–8 minutes. Individual airports lean one way or the other — in this snapshot, morning-peak airports (like LAX and SFO) crest around 8 AM, while evening-peak airports (like ATL) crest around 6 PM.
How TSA PreCheck changes the picture
Everything above is the standard lane. TSA's current claim for PreCheck is that 99% of enrolled passengers wait less than 10 minutes in PreCheck lanes (as stated April 2026). An independent March 2025 survey by Upgraded Points offers a rougher real-world check: self-reported total security time averaged 36 minutes with PreCheck versus 43 without — a 7-minute average saving on the whole process, though that is recall of the full security experience, not a stopwatch on the queue. We break the standard-vs-PreCheck gap down by airport in our PreCheck time-savings study; for whether membership is worth it for you, start with PreCheck vs CLEAR vs Global Entry.
Full table: modeled TSA waits at 32 large U.S. airports
The complete dataset behind this study. "Live" airports also have a real-time checkpoint feed on their live pages; "Modeled" airports show our forecast. Click any code for that airport's current wait.
| Airport | Avg wait | Peak | Best hour | Data |
|---|---|---|---|---|
| HNL Honolulu | 25 min | 40 min at 6 PM | 5 AM (12 min) | Modeled |
| BWI Baltimore | 24 min | 38 min at 6 PM | 5 AM (11 min) | Modeled |
| PHX Phoenix | 24 min | 38 min at 6 PM | 5 AM (13 min) | Live |
| AUS Austin | 23 min | 36 min at 6 PM | 5 AM (10 min) | Modeled |
| LAX Los Angeles Int'l | 23 min | 36 min at 8 AM | 5 AM (12 min) | Live |
| SFO San Francisco | 23 min | 35 min at 8 AM | 5 AM (12 min) | Live |
| TPA Tampa | 23 min | 35 min at 6 PM | 5 AM (14 min) | Modeled |
| DCA Washington · Reagan | 22 min | 35 min at 8 AM | 5 AM (9 min) | Modeled |
| MDW Chicago · Midway | 22 min | 34 min at 8 AM | 5 AM (10 min) | Modeled |
| BOS Boston | 21 min | 34 min at 6 PM | 5 AM (12 min) | Modeled |
| IAD Washington · Dulles | 21 min | 33 min at 6 PM | 5 AM (12 min) | Modeled |
| DTW Detroit | 21 min | 32 min at 7 PM | 5 AM (12 min) | Modeled |
| DEN Denver | 20 min | 30 min at 8 AM | 5 AM (8 min) | Live |
| FLL Fort Lauderdale | 20 min | 30 min at 8 AM | 5 AM (11 min) | Modeled |
| ORD Chicago O'Hare | 19 min | 30 min at 6 PM | 5 AM (11 min) | Modeled |
| PDX Portland | 19 min | 30 min at 8 AM | 5 AM (8 min) | Modeled |
| RDU Raleigh–Durham | 19 min | 30 min at 6 PM | 5 AM (10 min) | Modeled |
| ATL Atlanta | 19 min | 29 min at 6 PM | 5 AM (9 min) | Live |
| MIA Miami | 19 min | 29 min at 6 PM | 5 AM (11 min) | Live |
| IAH Houston · IAH | 18 min | 28 min at 8 AM | 5 AM (9 min) | Modeled |
| LAS Las Vegas | 17 min | 28 min at 6 PM | 5 AM (8 min) | Modeled |
| LGA New York · LGA | 17 min | 27 min at 8 AM | 5 AM (10 min) | Live |
| MSP Minneapolis–St. Paul | 17 min | 27 min at 6 PM | 5 AM (7 min) | Live |
| DFW Dallas/Fort Worth | 16 min | 26 min at 6 PM | 5 AM (7 min) | Modeled |
| EWR Newark | 16 min | 26 min at 8 AM | 5 AM (6 min) | Live |
| MCO Orlando | 16 min | 26 min at 6 PM | 5 AM (7 min) | Modeled |
| SLC Salt Lake City | 16 min | 26 min at 7 PM | 5 AM (8 min) | Modeled |
| BNA Nashville | 16 min | 25 min at 8 AM | 5 AM (8 min) | Modeled |
| CLT Charlotte | 15 min | 25 min at 6 PM | 5 AM (8 min) | Modeled |
| JFK New York · JFK | 15 min | 24 min at 8 AM | 5 AM (7 min) | Live |
| SAN San Diego | 15 min | 24 min at 6 PM | 5 AM (9 min) | Modeled |
| SEA Seattle–Tacoma | 14 min | 21 min at 8 AM | 5 AM (6 min) | Live |
Methodology
All wait figures are FIRST-PARTY MODELED ESTIMATES produced by tsawaittimes.app’s own forecasting model (the same Tier-B model that powers the live site), computed 2026-07-03 for the launch set of 32 large U.S. airports. They are not TSA or government measurements. For this snapshot every airport was computed via the model’s deterministic typical-day curve (an overnight lull with ~8 AM and ~6 PM peaks) scaled per airport, clamped to 4–75 minutes; the flight-schedule-density input was unavailable at run time. The national hour-by-hour shape is the model’s real typical-day curve, but per-airport differences come from the model’s seeded scaling — treat per-airport rows as “our model’s typical-day estimate,” never as a measured ranking of airports. Averages weight operating hours (4 AM–10 PM) at 1.0 and overnight hours at 0.25. Standard lanes only; 11 of the 32 airports also have live Tier-A checkpoint feeds (marked “live”). No day-of-week or seasonal term is included. Values rounded to whole minutes.
The same model powers the live pages on this site; 11 of the 32 airports additionally have Tier-A live checkpoint feeds. Full details on data tiers, update cadence, and limitations are on our methodology and data page. For a plain-language walkthrough of what drives a security line, see how long airport security takes.
Cite or share this data
Source: tsawaittimes.app — Average TSA wait times at U.S. airports: the data, 2026.
The tables and charts on this page are free to republish under CC BY 4.0 — just credit tsawaittimes.app with a link to this page. Please keep the "modeled estimate" labeling intact when quoting per-airport figures.
What is the average TSA wait time?
Across 32 of the largest U.S. airports, the tsawaittimes.app forecasting model estimates an average standard-lane TSA wait of about 19 minutes on a typical day (2026 snapshot). That is a modeled estimate, not a government measurement — TSA publishes a service standard (under 30 minutes in standard lanes, under 10 in PreCheck) but no official average. Waits swing widely by hour: the same national curve runs about 5 minutes overnight and about 30 minutes at the 6 PM peak.
Which airports have the longest TSA wait times?
In our model's 2026 typical-day snapshot, Honolulu (HNL) shows the highest average at 25 minutes, followed by Baltimore (BWI) and Phoenix (PHX) at 24 minutes each. Peak-hour estimates at the longest-wait airports reach 40 minutes. These are modeled typical-day estimates from our forecasting model, not measured rankings — any airport can beat or blow past its average on a given day.
How long does airport security take?
Plan on roughly 19 minutes in a standard TSA lane at a large U.S. airport on a typical day, per the tsawaittimes.app model — but the hour you arrive matters more than the airport. The modeled national curve runs about 10 minutes at 5 AM, 29 minutes at the 8 AM morning peak, and 30 minutes at the 6 PM evening peak. TSA's own service standard is under 30 minutes in standard lanes and under 10 minutes in PreCheck lanes.
What time of day are TSA lines shortest?
Early morning, before the first departure bank builds. In our model, 5 AM is the quietest reasonable hour at every one of the 32 airports studied, with modeled waits of roughly 6 to 14 minutes. The two windows to avoid are 7–9 AM (national modeled average peaks at 29 minutes) and 5–7 PM (30 minutes at 6 PM). Mid-morning through mid-afternoon sits in between, at about 17 to 20 minutes.
Averages plan trips; live waits catch flights
This study tells you what's typical. On travel day, your Leave-By Time counts backward from your flight using the current security wait at your airport, the drive, and the walk to your gate.
Get your Leave-By Time