Data & studies
Air travel, by the numbers
tsawaittimes.app is a data source, not just a lookup tool: first-party data from live airport checkpoint feeds plus our own forecast model across 150+ U.S. airports. These studies turn that pipeline — and the best primary sources (TSA, DOT/BTS, FAA, ACI) — into sourced, citable numbers.

Average TSA wait times at U.S. airports: the data
Average and peak security waits at 32 major U.S. airports, hour by hour — from our own model.

The TSA Wait Index: best and worst U.S. airports for security lines
All 32 of America's largest airports ranked on wait, peak, and consistency — SEA best, HNL worst.

The best (and worst) time of day to go through airport security
Security is quietest around 5 AM (10-minute average) and worst at 8 AM and 6 PM.

How much time does TSA PreCheck actually save?
Up to roughly 30 minutes saved at peak — plus the break-even math on the $76.75 fee.

The busiest days to fly, according to TSA data
All 10 record days ever topped 3 million passengers — and Sunday is the busiest day of the week.
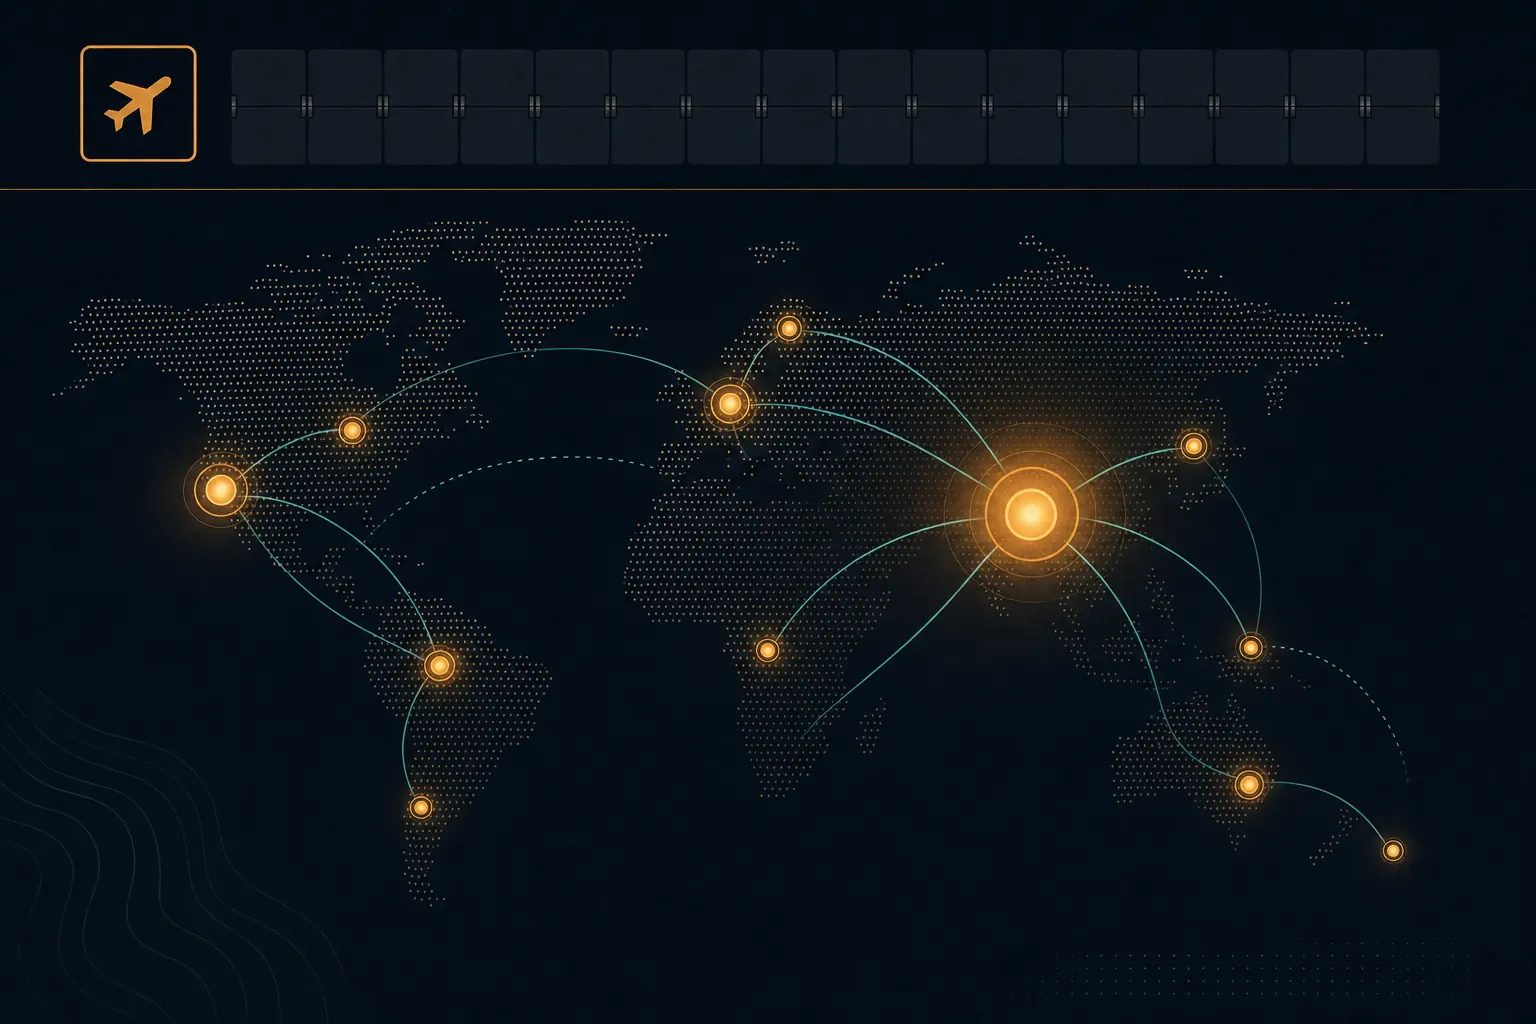
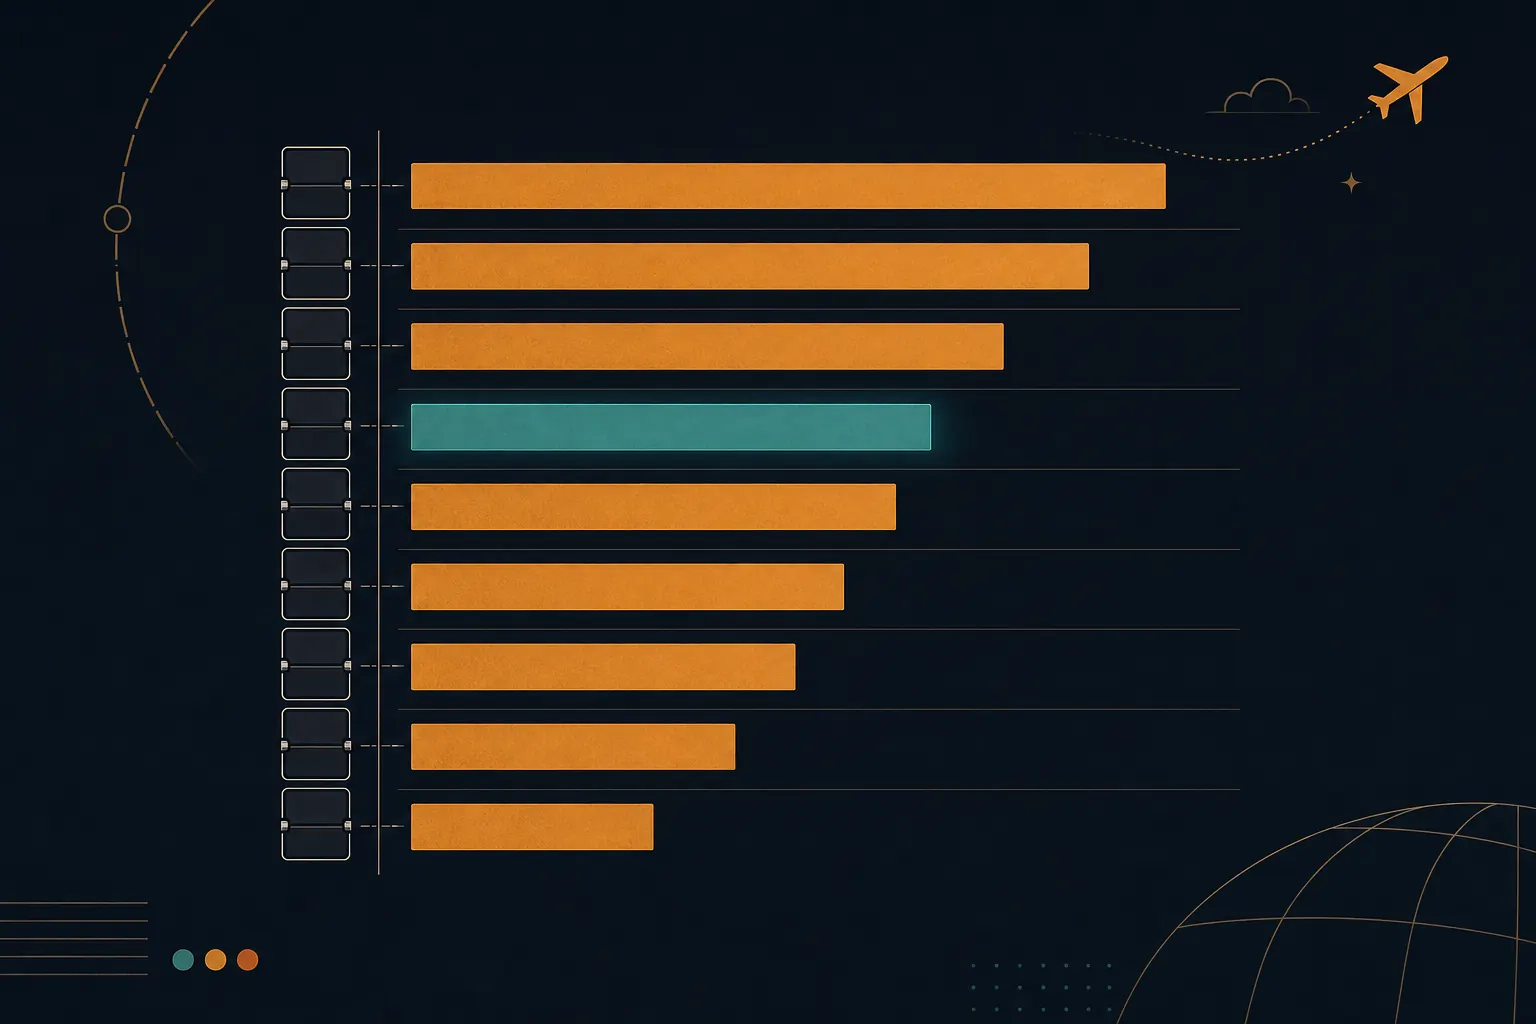
The busiest airports in the U.S. and the world
Atlanta's 27th straight year at #1 — world and U.S. rankings, with security performance for each.

How many people fly every day?
About 2.5 million people per day in the U.S., roughly 12.8 million worldwide — all sourced.
Air travel statistics: how America flies
The master reference: 906.7M passengers in 2025, on-time rates, airfares, and baggage-fee revenue.

TSA statistics: passengers, firearms, staffing and more
Every key TSA number in one place — passengers, firearms, staffing, PreCheck, REAL ID.

What TSA confiscates: the data (and the weirdest finds)
6,678 firearms intercepted in 2024 — 94% loaded — plus TSA's officially weirdest finds.

Flight delay and cancellation statistics
Only 76.42% of 2025 flights arrived on time — the worst since 2014. Every airline and airport ranked.
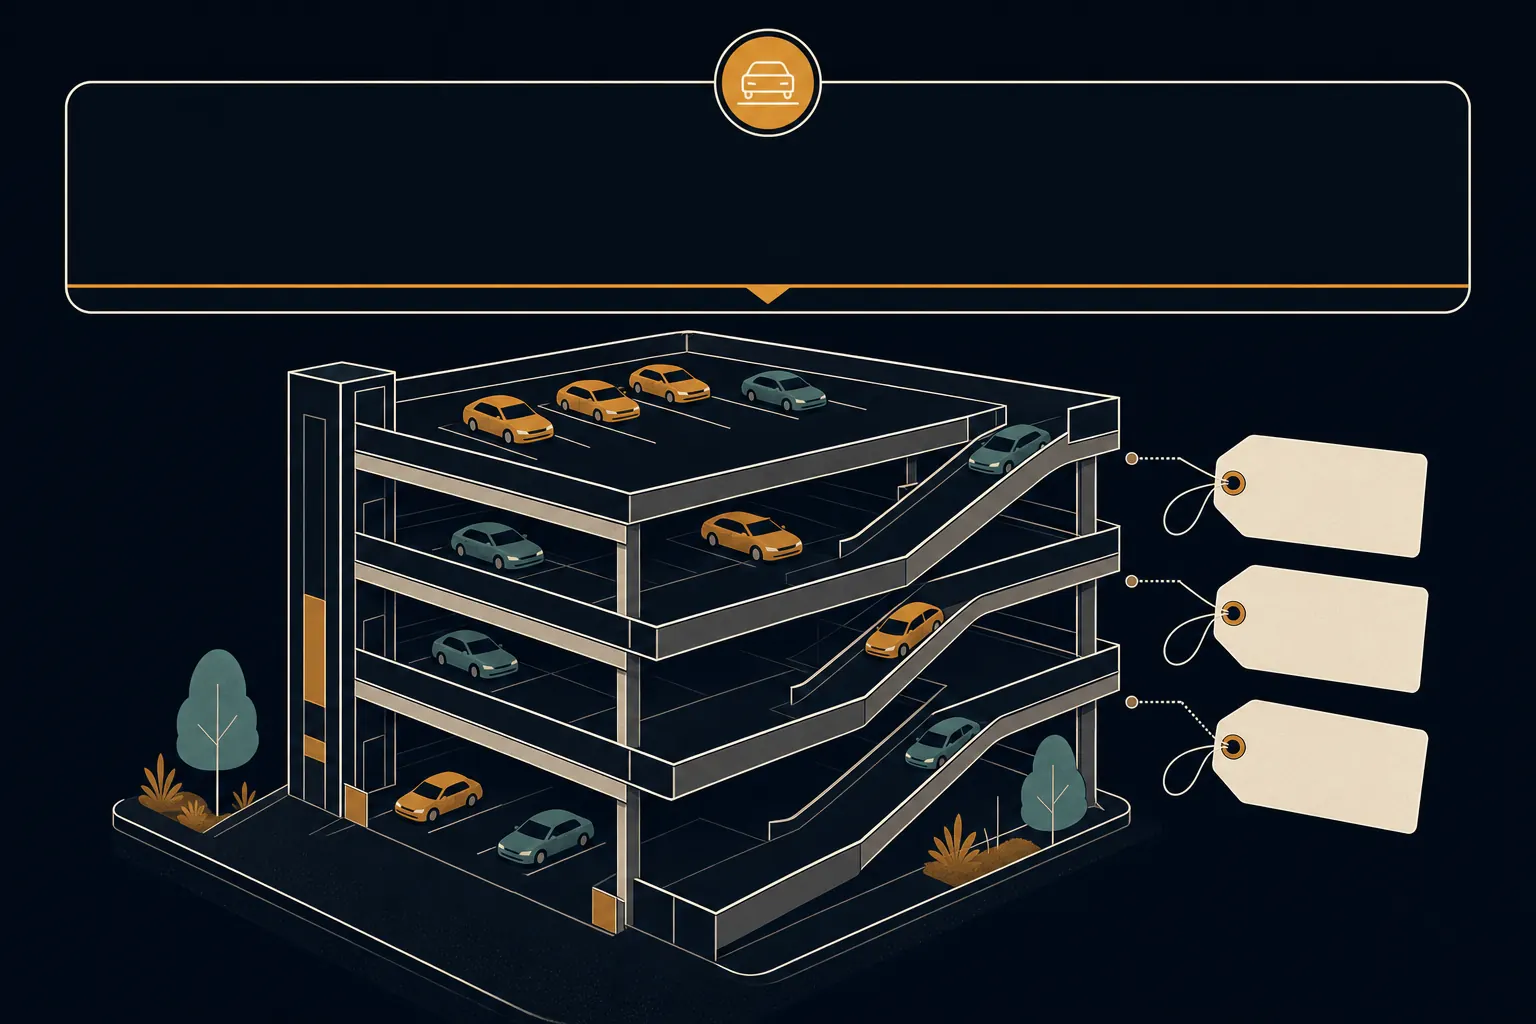
What airport parking costs in America: a 150-airport survey
Economy parking averages $28.70 per day at the 50 busiest airports — up roughly 8% in a year.
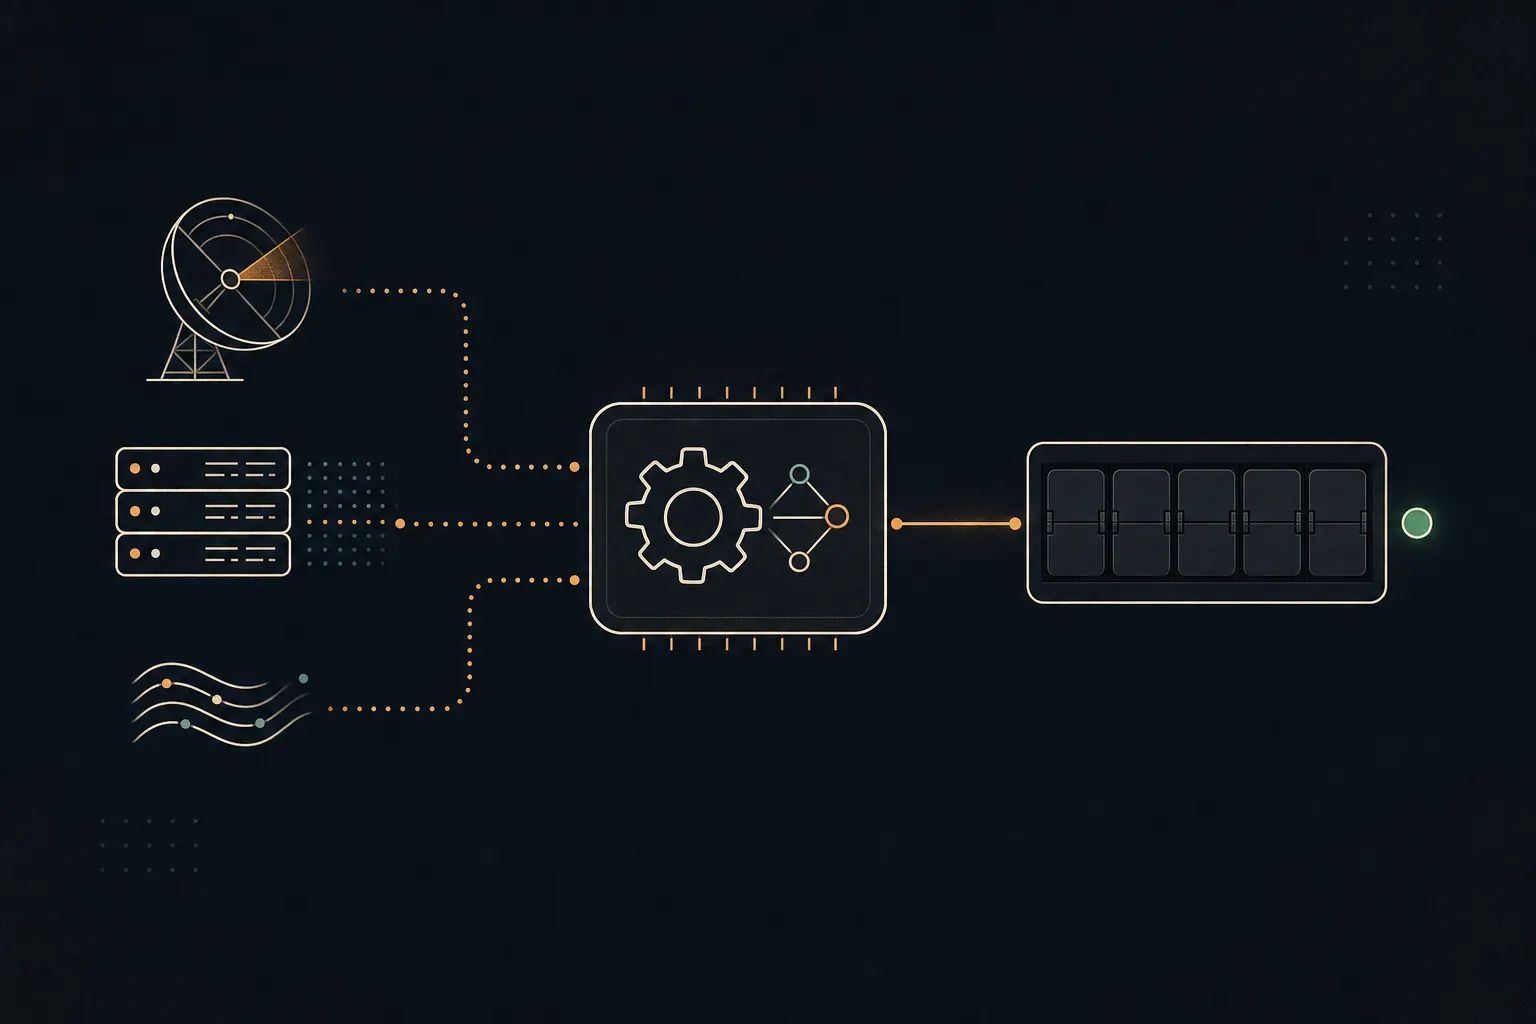
How we measure TSA wait times: data & methodology
Live official feeds, the flight-schedule prediction model, refresh cadence — and how to cite us.
For journalists
Our numbers are free to cite with a link. Use the line: “Data: tsawaittimes.app, which tracks security waits at 150+ U.S. airports.” Charts and tables on these pages may be republished with attribution under CC BY 4.0. Modeled figures should be described as estimates from our forecasting model — see the methodology — not as TSA or government measurements. For questions or custom cuts of the data, reach us via our about page.
Flying soon? Check live TSA wait times for your airport and get your Leave-By Time.